Habitat Loss
Salmon need cool, clean rivers and streams, estuaries (where rivers meet saltwater), and oceans. In Washington, this habitat has been degraded severely in the past 150 years. Humans logged streamside forests starting in the 1800s and continuing through the 1980s. They straightened streams, cleared them of logs and root wads (which biologists later discovered were important habitat for salmon), and built levees and ditches, disconnecting rivers from their floodplains. While a lot has been learned and much progress has been made to modify past practices, there remains much work ahead to undo past, outdated practices.
PRESSURE: Human Population Growth and Development
![]()
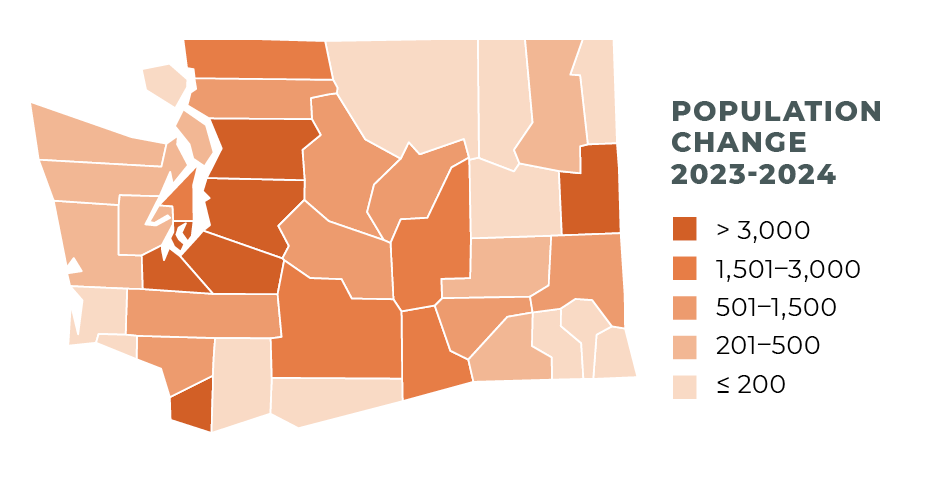
Washington’s population reached eight million in 2024, nearly doubling the state’s population in 1980,1 and is expected to pass nine million by 2038.2 Salmon, like people, need habitat. For salmon, this means rivers with cool, clean water and a variety of features that allow them to rest, hide from predators, and spawn. It means diverse estuaries where salmon can grow and transition to and from saltwater. And it means rivers, shorelines, and an ocean with ample food.
The habitat salmon need does not stop at the water’s edge. Healthy salmon habitat includes the trees and shrubs alongside the river (known as riparian areas) that help to cool and filter water and prevent soil erosion. It includes floodplains with streams and small waterways that salmon can access throughout the year. These well-connected floodplains act to buffer the effects of climate change and are critically important for salmon.3 Floodplains slow, filter, and store flood water; provide shelter and food for young fish; and buffer communities against floods. Unfortunately, 50-90 percent of land along waterways in Washington has been lost or extensively modified by humans.4 In many cases, this is because habitat for people and salmon conflict: residential, commercial, and industrial development displaces or destroys salmon habitat in floodplains and on shorelines.

Washington’s population is expected to grow and pass nine million by 2038.
As the number of people in the state continues to increase, more land and water are needed for people to live, work, and play. As a result, humans must find ways to live on the land and to use water more efficiently and judiciously if salmon are to be saved for future generations. This requires working together to build on what is working and to change what is not. Those most effected must be at the table. This includes the interests of salmon, development, industry, agriculture, and others so that the long-term solutions are durable. Solutions also must build on what the work that has come before at the watershed and regional levels, which has established long-standing partnerships between local communities, Tribes, and others invested in healthy watersheds.
PRIORITIES AND PROGRESS
![]() The 2021 Governor’s salmon strategy update emphasizes the value of maintaining, preserving, and restoring riparian lands. This will ensure cooler rivers and streams, climate resiliency, and the health of fish, other wildlife, and ecological systems for the economic and social well-being of this state and its people.
The 2021 Governor’s salmon strategy update emphasizes the value of maintaining, preserving, and restoring riparian lands. This will ensure cooler rivers and streams, climate resiliency, and the health of fish, other wildlife, and ecological systems for the economic and social well-being of this state and its people.
Increased state and federal funds are supporting grant programs that conserve and restore freshwater stream and riparian areas, marine shorelines, and estuaries. This infusion of funds has allowed groups around the state to approach larger, more complex projects that make meaningful progress toward habitat restoration and conservation targets. Despite this infusion, much more funding and predictability of funding is necessary to achieve habitat goals in support of salmon recovery.
Current regulations protecting habitat generally aim for “no net loss,” meaning that development avoids or mitigates damage to habitat and watershed functions. In practice, however, these regulations are interpreted, administered, and enforced inconsistently across the state, and habitat is being lost. Updating local, state, and federal land-use programs (and enforcing them) is one key way to reverse the decline of habitat in Washington while accommodating growth.
PRESSURE: Simplified Streams and Habitat Loss
 More than a century of heavy human use and activity has created simplified, straightened, high-energy rivers and streams that carry water efficiently and swiftly from mountains to ocean. People have straightened and simplified rivers to reduce flooding and increase the amount of land for farming, homes, and industry. Unfortunately for salmon, this efficient transportation of water also has disrupted the natural processes and habitats needed to support salmon and people.
When humans straighten a stream, the speed of the water increases, eroding the riverbed and banks. The Department of Ecology’s5 data shows about 70 percent of streams sampled throughout the state have unstable beds, meaning that the erosive power of the water can damage salmon redds (nests) and flush out insects that young salmon eat. In addition, when banks erode, the soils can bury salmon redds, killing the eggs. Fast-moving water also removes logs, tree limbs, and rocks that normally would slow the river, enabling the river to go faster and erode more. As the bottom soil and gravel are removed, the bottom of the river lowers and further disconnects the river from its floodplain. This cycle of erosion and disconnection means that rivers are not able to recover more salmon-friendly conditions without habitat restoration projects.
PRIORITIES AND PROGRESS
![]() In some areas, protecting stream corridors is enough to allow them to recover to healthier conditions. Protective regulations such as local critical areas ordinances and Washington’s 1999 Forest and Fish Law are designed to prevent further habitat damage while allowing continued logging and development.
In some areas, protecting stream corridors is enough to allow them to recover to healthier conditions. Protective regulations such as local critical areas ordinances and Washington’s 1999 Forest and Fish Law are designed to prevent further habitat damage while allowing continued logging and development.
In other areas, however, protective regulations are not enough, and habitat restoration work is needed to jumpstart habitat recovery. State, federal, and private granting organizations provide funding for a wide variety of habitat restoration activities, including reintroducing logs and tree root wads to streams and reconnecting streams with their floodplains, both of which help reduce streambed and bank erosion and create habitat for salmon.
Salmon Need Healthy Places to Live
The Riparian Zone video by Northwest Treaty Tribes
PRESSURE: Shoreline Armoring
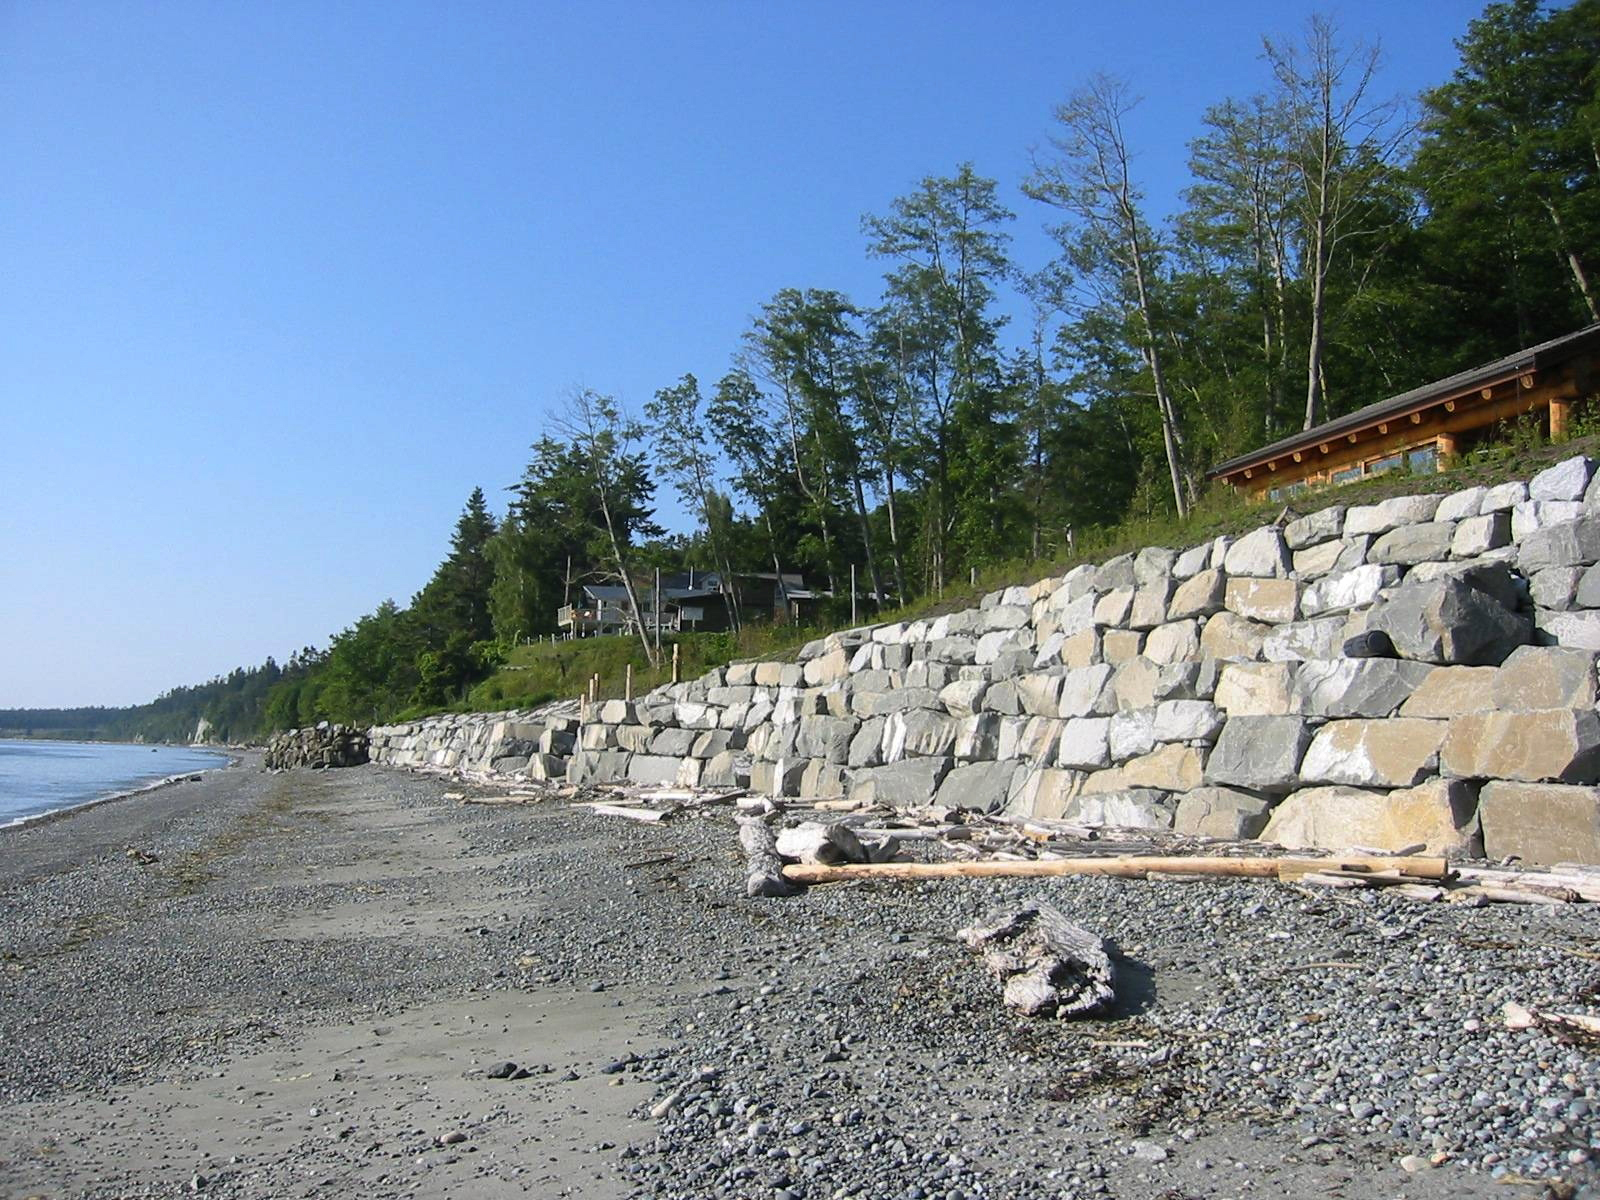
![]() Puget Sound has lost habitat function across one-third of its twenty-five hundred miles of shoreline to armoring.6 Armoring includes bulkheads, seawalls, and other structures built on the shoreline to protect houses and other infrastructure. These hardened shorelines alter salmon and forage fish habitat and significantly impact natural shoreline processes. Armor prevents waves from eroding bluffs to create beaches, where salmon find the insects and other fish they eat.
Puget Sound has lost habitat function across one-third of its twenty-five hundred miles of shoreline to armoring.6 Armoring includes bulkheads, seawalls, and other structures built on the shoreline to protect houses and other infrastructure. These hardened shorelines alter salmon and forage fish habitat and significantly impact natural shoreline processes. Armor prevents waves from eroding bluffs to create beaches, where salmon find the insects and other fish they eat.
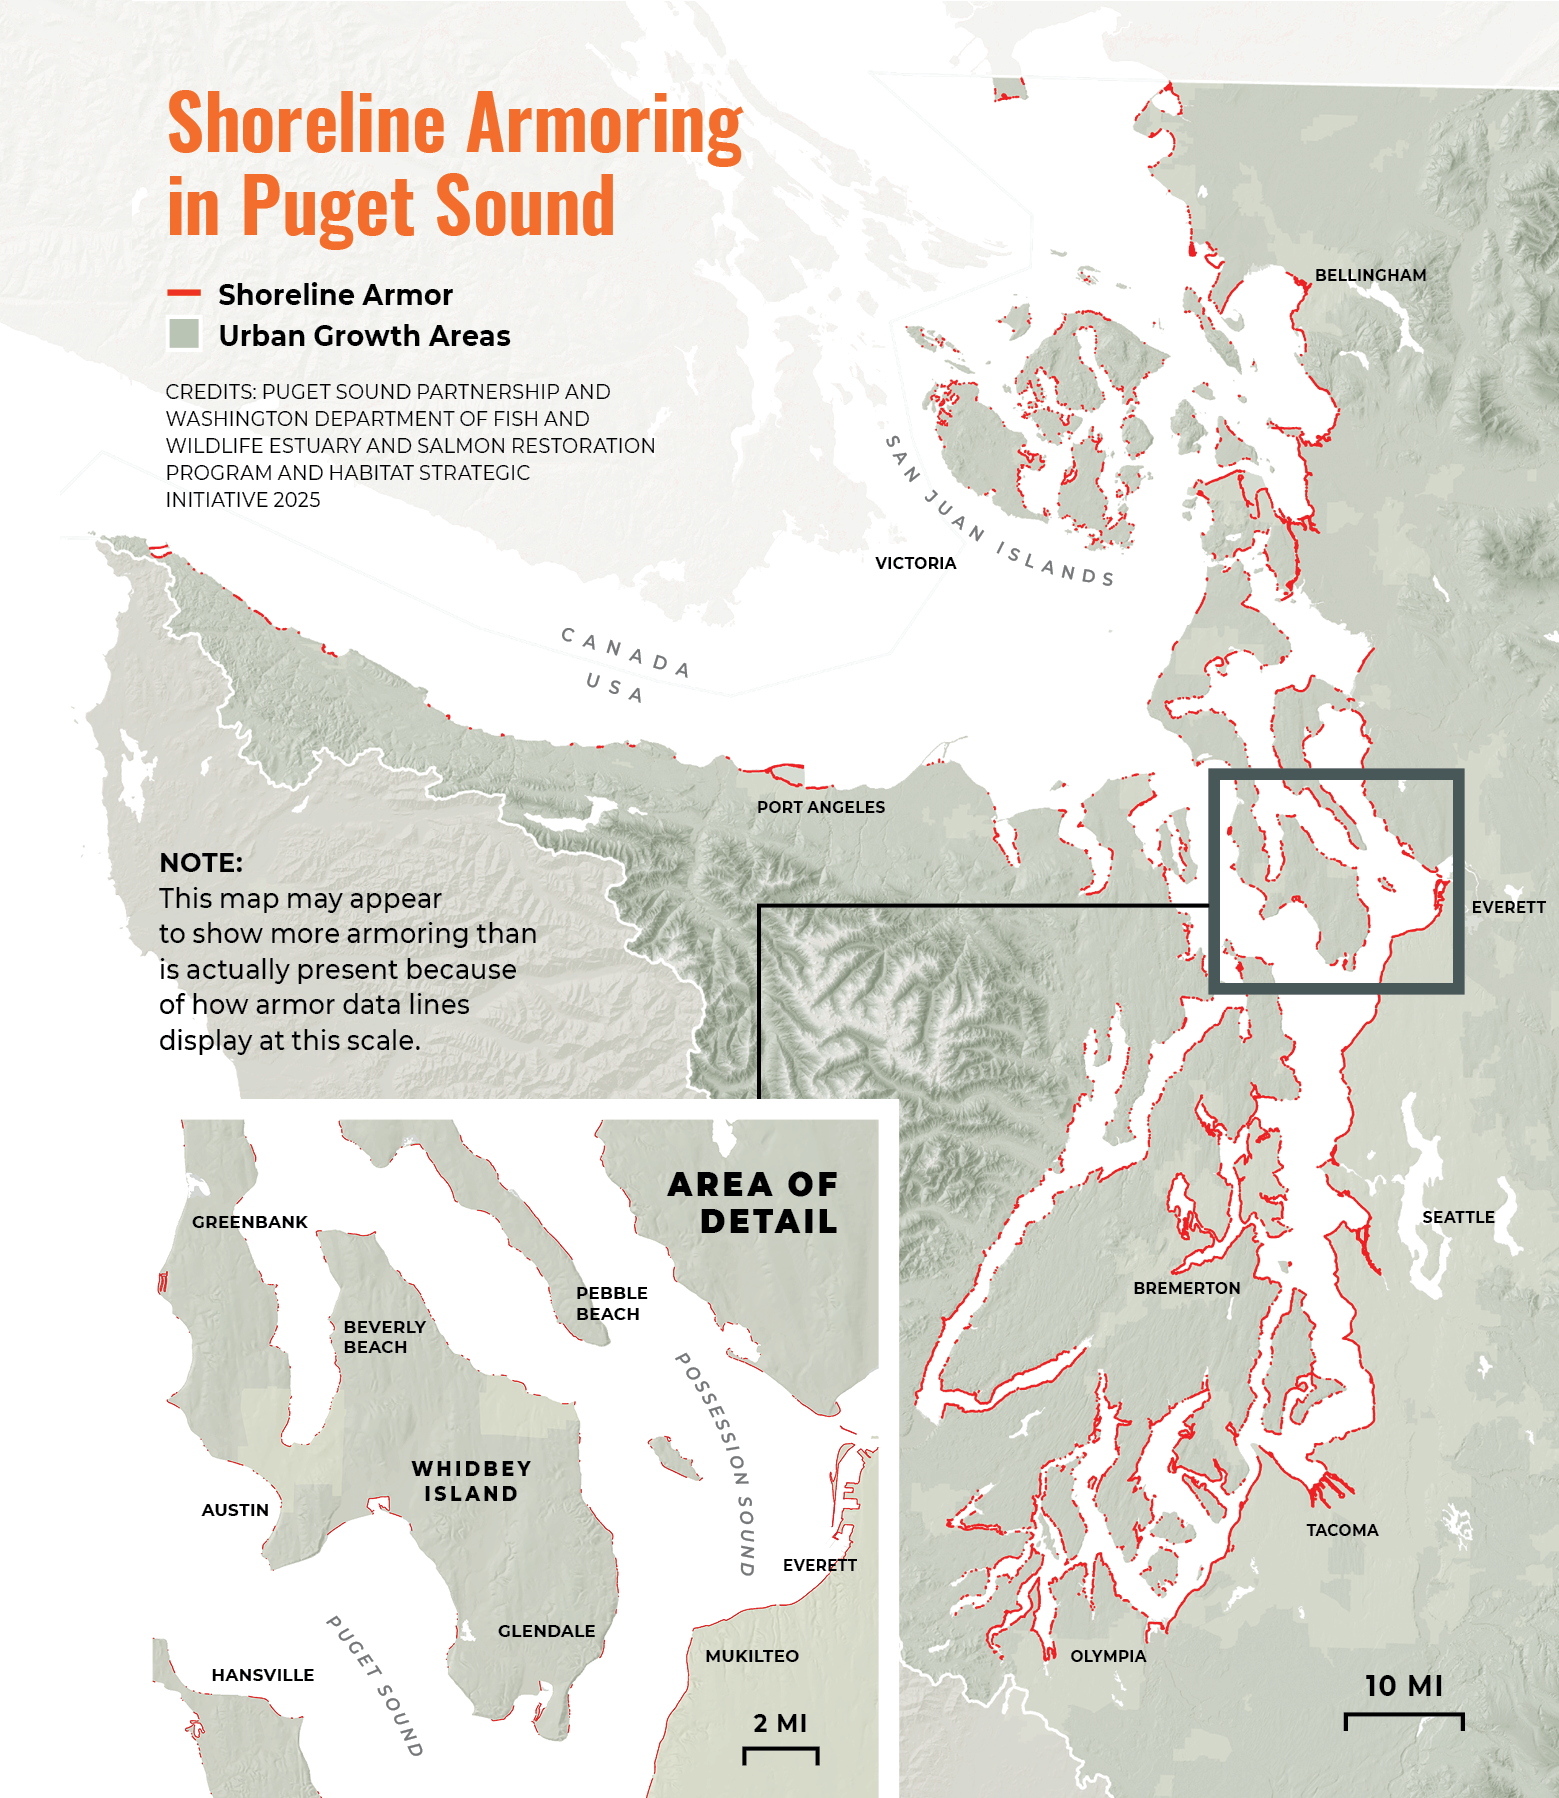
Puget Sound has lost habitat function across one-third of its twenty-five hundred miles of shoreline to armoring.
PRIORITIES AND PROGRESS
![]() Modern regulations have prevented most new shoreline armoring projects, or at a minimum, have required mitigation (actions at the site or elsewhere) that ensure that overall habitat conditions stay the same or improve, known as “no-net-loss” of habitat function. In recent years the total amount of shoreline armoring has declined in Puget Sound, in part due to improving practices that account for multiple benefits and the needs of salmon and people.
Modern regulations have prevented most new shoreline armoring projects, or at a minimum, have required mitigation (actions at the site or elsewhere) that ensure that overall habitat conditions stay the same or improve, known as “no-net-loss” of habitat function. In recent years the total amount of shoreline armoring has declined in Puget Sound, in part due to improving practices that account for multiple benefits and the needs of salmon and people.
While many of Puget Sound’s shorelines are armored, grant programs are available for landowners who would like to remove unnecessary armor or rebuild failing bulkheads with more natural alternatives that do less harm to beach habitat. These programs aim to restore shoreline habitat yet maintain or even improve the ability to buffer against rising seas and other impacts from climate change.
More Information About Habitat
-
Habitat Quality
The Watershed Health Monitoring program, run by the Washington Department of Ecology, measures the statewide and regional condition of stream habitat. It collects data about habitat and biological conditions in streams and adjacent riparian areas.
In this report, information is presented about four qualities of good salmon habitat: forested streambanks (riparian cover or canopy), logs and root wads in the water (large wood volume), a healthy amount and mix of bug species (an index of biotic integrity), and clean water (low sediment levels), each explained below.
Of all stream miles measured by the Washington Department of Ecology, the following conclusions are noted:
- 28 percent have sparse canopy (riparian cover).
- 18 percent have low wood volume.
- 30 percent have poor biological condition as measured by the index of biotic integrity.
- 53 percent have too much fine sediment.
Stream Length with Poor Habitat
Statewide roll-up showing percentage of stream miles with poor habitat quality
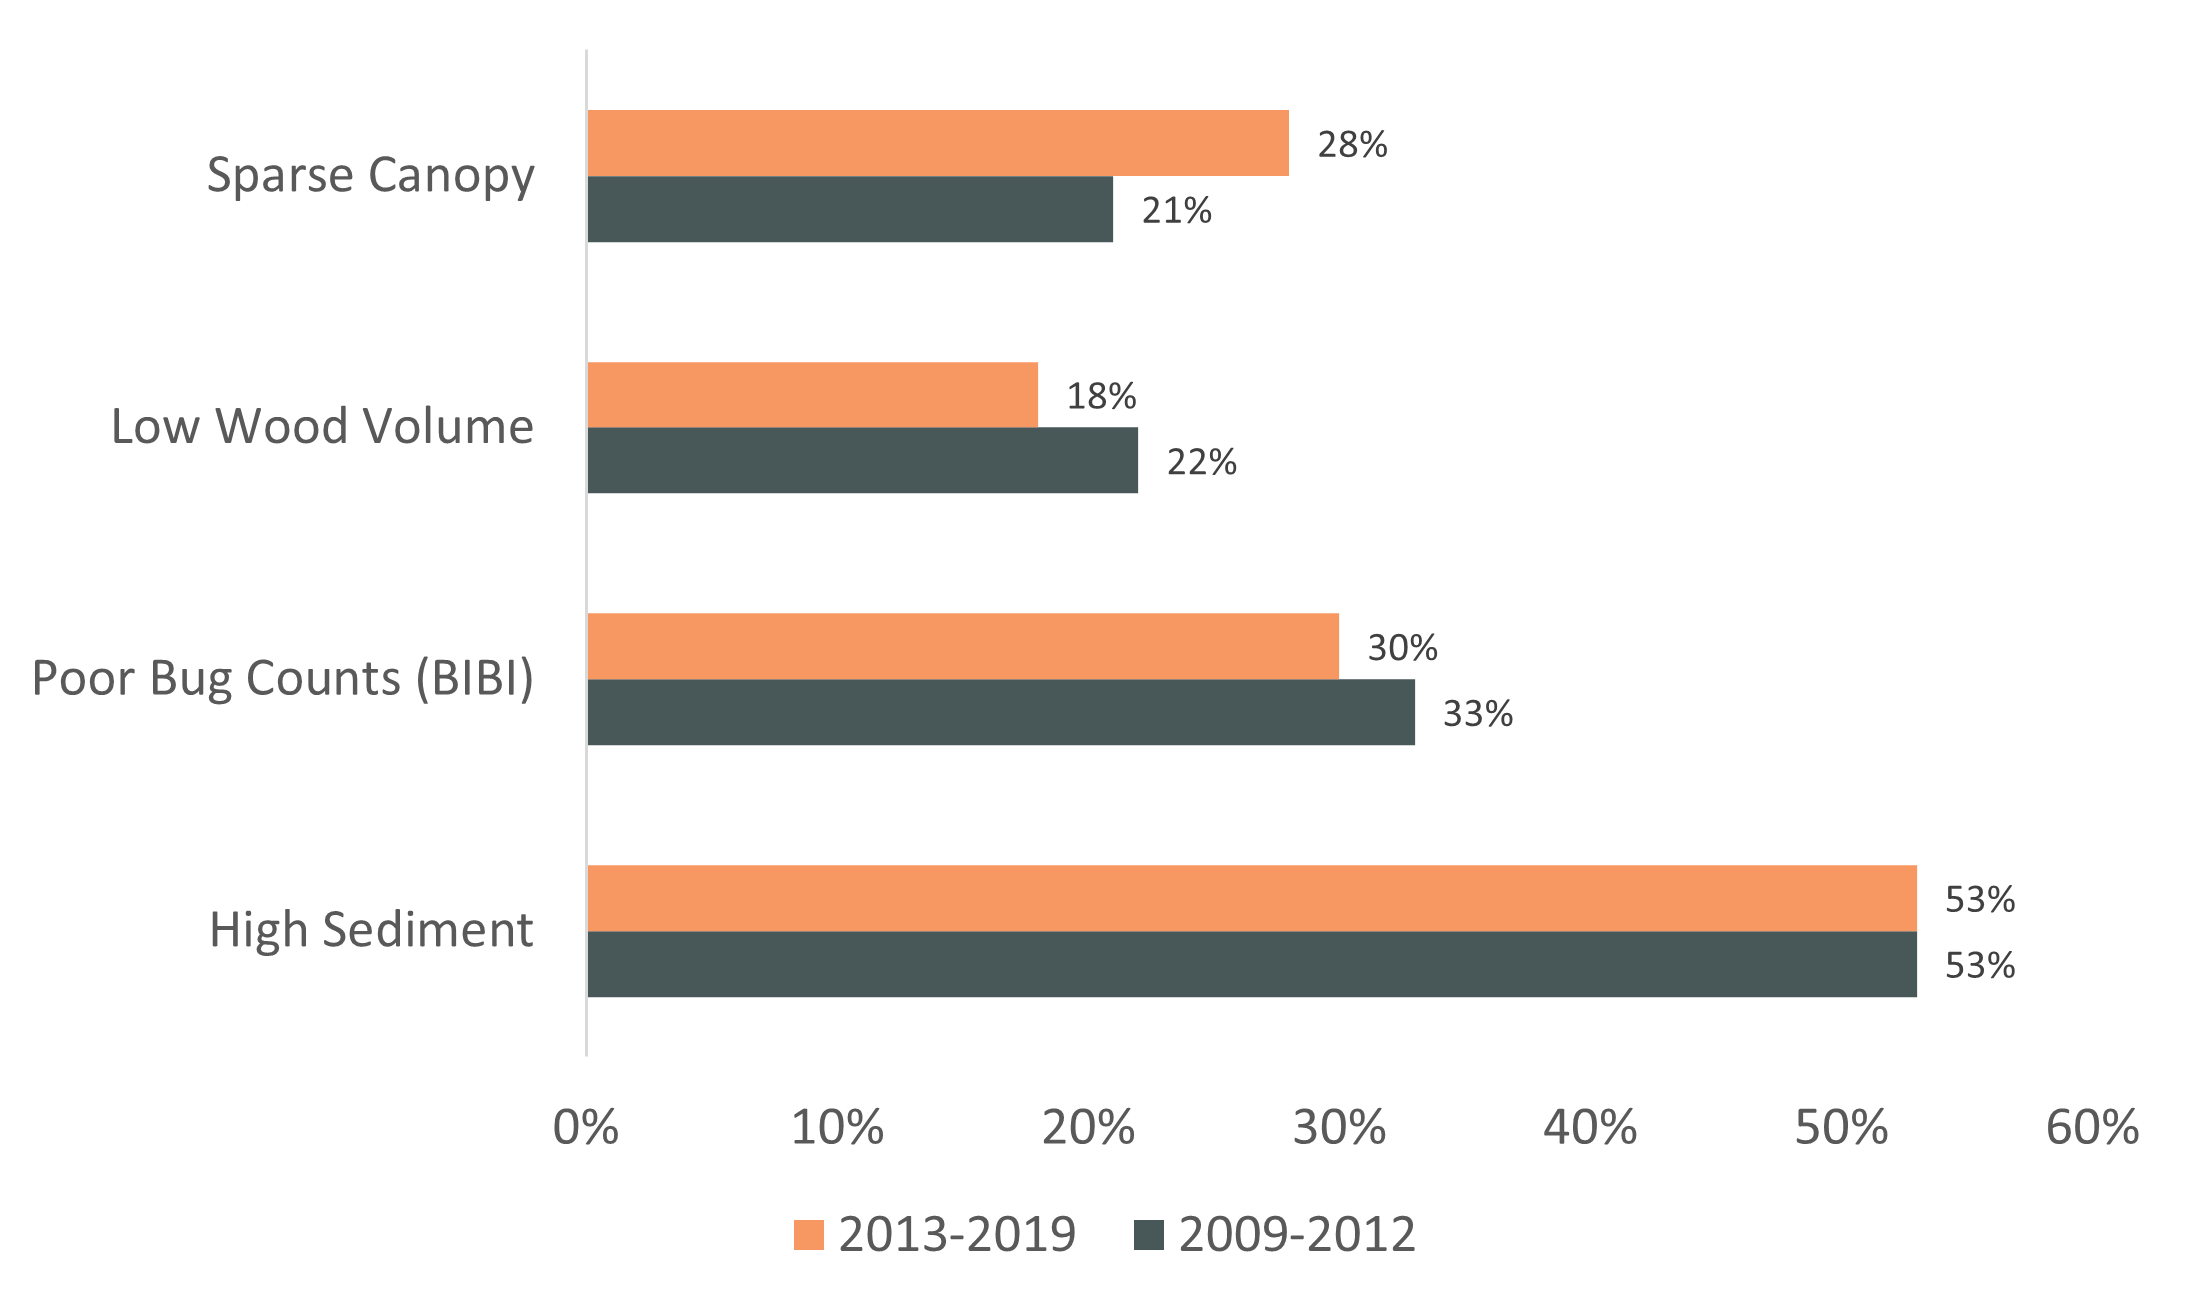
Data Source: Washington Department of Ecology
More Information About These Measures
Riparian areas are shorelines, stream banks, wetlands, and floodplains next to bodies of water that support and protect the health of the water. Plants in these areas shield streams from summer and winter temperature extremes, which can be fatal to fish. Leaves and branches shade the stream, keeping the water cool for salmon during warm months. Shade also can limit growth of algae. Excessive algae when it decays, robs oxygen from the water leaving less for fish. The plants also drop branches, leaves, and insects into the water. This provides food for fish. When branches and logs fall into streams, they slow the water and give salmon places to rest while feeding and places to hide from predators. Finally, the roots of the streamside plants prevent soil from entering the water and burying spawning gravel. Vegetation also filters contaminants out of the soil, reducing the amount entering water.
The Department of Ecology measured riparian cover at randomly selected streams. Ecology determined sparse levels of riparian cover by comparing the measurements with a separate set of relatively natural reference streams in each of three areas: western Washington, the eastern mountains of Washington, and the Columbia Plateau. More monitoring is necessary to see if this pattern in the chart persists and represents a trend.
Large wood in the form of tree root wads and logs are good for salmon. Healthy watersheds have enough trees to maintain an adequate supply of wood to fall into streams. Otherwise, adding wood to streams is a common way to immediately improve fish habitat while the watershed recovers. The wood slows the stream, which creates places for fish to rest and hide from predators. A slower stream will erode its banks less and therefore transport less sediment to the river. Wood also creates deep, cool pools. Wood also helps streams retain organic matter and nutrients, which are a food source for the insects and fish salmon eat.
The Department of Ecology rated whether the volume of wood in streams was low. Ratings were based on comparison to reference streams. Scoring levels depend upon the natural setting and the width of the stream.
Stream Biological Health (or bug counts to nonscientists) are another way to measure the health of a stream. If there is a good mix of species, it’s likely a healthy stream. When scientists look at biotic integrity, they are looking to see if the stream has the “ability to support and maintain a balanced, integrated, adaptive assemblage of organisms having species composition, diversity, and functional organization comparable to that of natural habitat of the region.” (Karr and Dudley 1981). In this report, the Department of Ecology examined biotic integrity for one assemblage, stream invertebrates.
A Benthic Index of Biotic Integrity (BIBI) measures collections of insects and similarly sized animals found on stream bottoms. Scientists look at their species compositions to assess stream conditions. Each species has a characteristic response to human-caused environmental changes. Ten data values (metrics) are combined into a single number (index) that provides an overall score. These types of indexes are used by many environmental monitoring programs throughout the world. The Department of Ecology has assigned poor ratings to BIBI scores, based on comparison to relatively natural conditions in each of three zones in the state: western Washington, eastern mountains, and the Columbia Plateau.
The bars in the graph reflect percent of estimated statewide stream length with poor BIBI scores.
Sediment can lower stream health. Although sedimentation is part of the natural cycle, land-disturbing activities cause extra sand and finer-sized particles to run into streams. This excess sediment causes many problems for salmon, including smothering fish eggs, changing the shape and route of the stream, and reducing the stream’s capacity to hold floodwater or provide cover for fish.
Department of Ecology field crews looked at hundreds of equally spaced locations on the bottom of each stream and counted how many locations in each stream were occupied by particles that were the size of sand or smaller. Based on one report (Bryce et al., 2010), 15.2 percent sediment in a stream is generally the best for stream invertebrates. Therefore, more than 15.2 percent sediment is considered “high.” (Note: The Department of Ecology added 5.5 percent to Bryce values after comparing results from two field methods. Department of Ecology measures across a larger portion of the stream channel than does Bryce.)
-
Habitat Projects
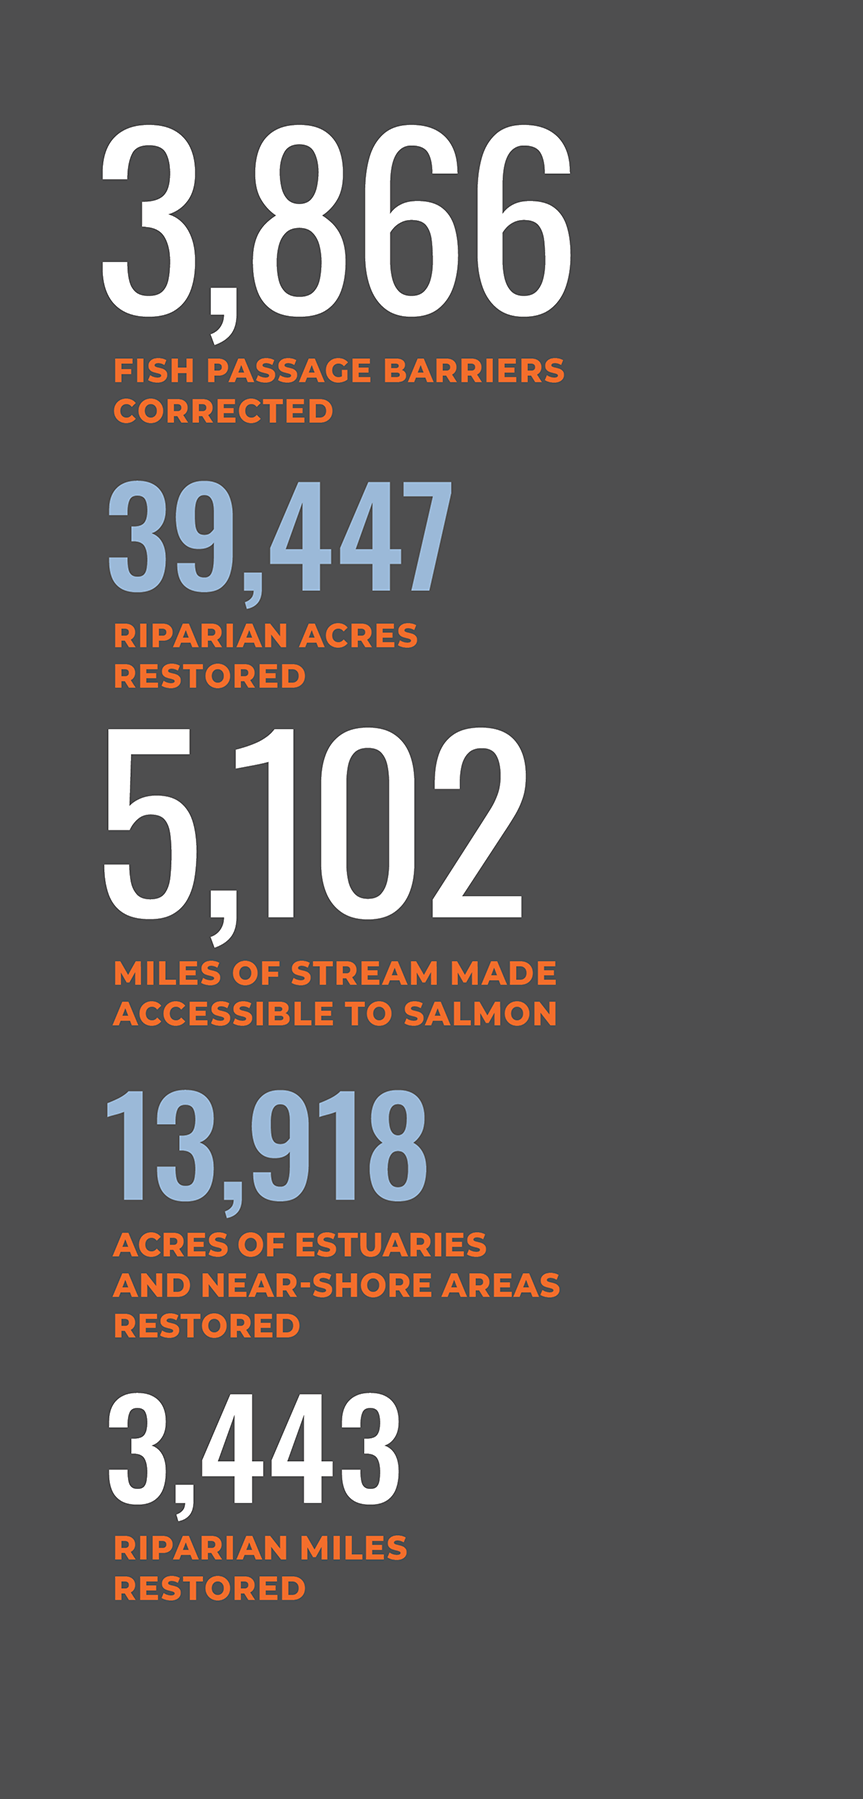
In some areas, habitat has been restored, and the number of fish has increased. Washington’s salmon recovery organizations and tribes work hard to restore and protect salmon, steelhead, and bull trout habitat all over the state.
Included in the graphic below are restoration measures for three types of projects: riparian habitat treatments, estuary habitat treatments, and fish passage barrier corrections. It is important to note that this data only includes what is tracked by the Recreation and Conservation Office’s Salmon Recovery Portal and PRISM Project Search databases.

1Washington State Office of Financial Management (2024a) April 1 postcensal estimates of population: 1960-present. https://ofm.wa.gov/washington-data-research/population-demographics/population-estimates/historical-estimates-april-1-population-and-housing-state-counties-and-cities Accessed November 15, 2024.
2Washington State Office of Financial Management (2024b) State Population Forecast (November 2024). https://ofm.wa.gov/washington-data-research/population-demographics/population-forecasts-and-projections/state-population-forecast Accessed November 15, 2024.
3Quinn, T., Wilhere, G. and Kruger, K. (2018) Riparian Ecosystems, Volume 1: Science Synthesis and Management Implications. Washington Department of Fish and Wildlife. Olympia, WA.
4Lea Knutson, K., and Naef, V.L. (1997). Management Recommendations for Washington’s Priority Habitats. Washington Department of Fish and Wildlife, Olympia, WA, https://wdfw.wa.gov/sites/default/files/publications/00029/wdfw00029.pdf
5Washington Department of Ecology (2024) Watershed Health Monitoring Regional Reports. https://ecology.wa.gov/research-data/monitoring-assessment/river-stream-monitoring/habitat-monitoring/watershed-health/regional-reports Accessed November 15, 2024.
6Puget Sound Partnership. (2022) 2022-2026 Action Agenda for Puget Sound, Puget Sound Partnership, Olympia, WA. p.40. https://pspwa.box.com/shared/static/8zak4wiakdy94vc6104er8l3kn9bdxkw.pdf
