Water Quality
Salmon need cool, clean water throughout their lives, whether in streams, lakes, or the ocean. Global climate change and local development is warming and polluting water that salmon need to survive. Urban stormwater runoff, particularly during western Washington’s wet autumns, delivers toxic chemicals into waterways from concrete and other impervious surfaces that keep rain from soaking into the ground. During warmer, drier summers and autumns, the amount of water in streams drops and water temperatures rise, a pattern becoming more extreme in recent decades.
PRESSURE: Stormwater Runoff
![]() Stormwater running off impermeable surfaces is the top pollution source impacting Puget Sound.1 As cities and suburbs have expanded, impermeable surfaces such as pavement, roofs, and other hard surfaces have increased.
Stormwater running off impermeable surfaces is the top pollution source impacting Puget Sound.1 As cities and suburbs have expanded, impermeable surfaces such as pavement, roofs, and other hard surfaces have increased.
Rain runs off these surfaces, collecting pollution from oil, fertilizers, pesticides, vehicles, and animal manure before heading, usually untreated, into street drains and then directly into streams, bays, and the ocean. Untreated stormwater can decrease the oxygen levels in the water,2 limit the ability of some salmon species to find food and avoid predators, make fish more susceptible to disease, and kill large numbers of fish in urban streams.3
Stormwater running off impermeable surfaces is the top pollution source impacting Puget Sound.
PRIORITIES AND PROGRESS
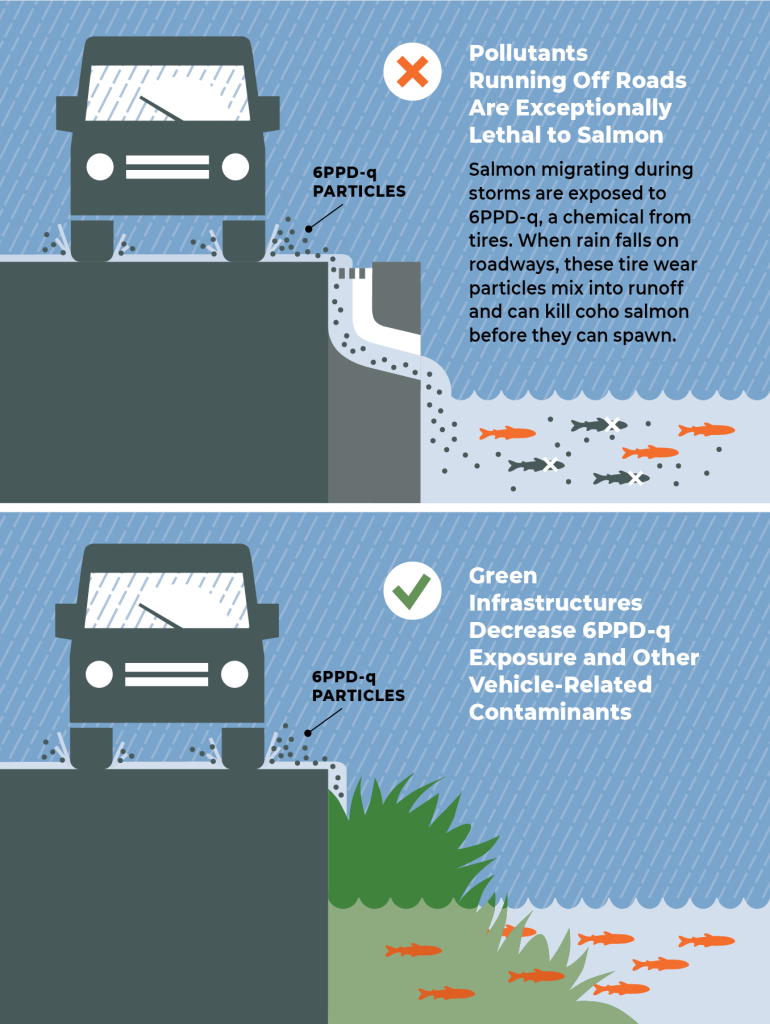
![]() In 2021, after years of investigation, a team of researchers from the University of Washington, Washington State University, and others isolated 6PPD-quinone, a compound formed from a common chemical used in tire manufacturing, as the chemical killing coho salmon in urban streams.4,5 Researchers previously found that running stormwater through systems like rain gardens (known as “green infrastructure”) removes pollutants and reduces harm to coho.6 These discoveries, coupled with stormwater requirements, will help protect salmon in cities and help address impacts of Washington’s growing population on salmon.
In 2021, after years of investigation, a team of researchers from the University of Washington, Washington State University, and others isolated 6PPD-quinone, a compound formed from a common chemical used in tire manufacturing, as the chemical killing coho salmon in urban streams.4,5 Researchers previously found that running stormwater through systems like rain gardens (known as “green infrastructure”) removes pollutants and reduces harm to coho.6 These discoveries, coupled with stormwater requirements, will help protect salmon in cities and help address impacts of Washington’s growing population on salmon.
The Washington Department of Ecology is the lead agency for the state on 6PPD, in addition to its other toxics-reduction work. The state’s work on 6PPD is focused on three main objectives:
- Reducing sources of 6PPD in the environment and identifying a safer alternative.
- Reducing the impact of 6PPD in the environment.
- Researching 6PPD’s effect on the health of humans and animals that live it the water.

Other Water Quality Challenges
-
Water Temperature
Water Temperature Violations Across the State
The data in the chart below are collected by the Washington Department of Ecology from 187 stations across the state. These stations are used to record various water quality parameters including oxygen levels, bacteria concentration, and water temperature. Metrics collected at these stations are compared to set the standards to regulate water quality. Where the recorded temperature was above the set standard, it is considered a violation.
Looking at the number of violations a station has over time can provide insight into trends in water temperature. Using this data, in combination with other current research, scientists can see an increasing trend in the number of times water temperature was warm enough to exceed the standard. Across the state, there have been substantially more exceedances since 1997.
Frequency of Water Quality Temperature Violations Over Time
Data Source: Washington Department of Ecology
-
Water Quality Index Scores
Cold, clean water is essential for salmon and steelhead. This water quality measurement looks at temperature, acidity, and levels of oxygen, bacteria, nutrients, and sediment. The overall quality of Washington’s waters, not considering toxics, has improved since 1994.
The water quality at 48 percent of long-term water quality monitoring sites is improving.
Declines were seen at only 4.6 percent of the monitoring sites while 47.4 percent show no significant trend from 1994-2017.


Routine freshwater monitoring data collected by the Washington State Department of Ecology’s River and Stream Monitoring Program are summarized by a technique called the “Water Quality Index.” The index ranges from 1 (poor quality) to 100 (good quality).
The map shows water quality index scores for long-term stations with five or more years of monthly data and may include stations monitored by organizations other than the Department of Ecology.
All current long-term Ecology monitoring stations with at least five years of data are included. Most stations shown are near the mouths of major streams. These stations integrate upstream water quality and capture large, basin-scale trends. However, status and trends at these locations may not reflect status or trends in any particular subbasin.
Annual scores were determined by water year, which runs from October to September, beginning with Water Year 1994.
The index summary does not include non-standard elements like metals. For temperature, pH, oxygen, and fecal coliform bacteria, the index is based on criteria in Washington’s Water Quality Standards, Washington Administrative Code 173-201A. For nutrient and sediment measures where standards are not specific, results are based on expected conditions in a given region. Multiple constituents are combined and results aggregated over time to produce a single score for each station and each year.
Find out more about water quality: The Department of Ecology’s Water Quality Atlas is an interactive search and mapping tool that accesses Water Quality Assessment category results by geographic location, water quality standards by location, areas covered by Total Maximum Daily Loads, and permitted wastewater discharge outfalls.
The Department of Ecology’s Freshwater Information Network is an interactive, map-based tool to search for freshwater monitoring data and sites across the state and is the source behind the Water Quality Index data presented in this report.
Water Quantity
PRESSURE: Low Summer Flows
![]()
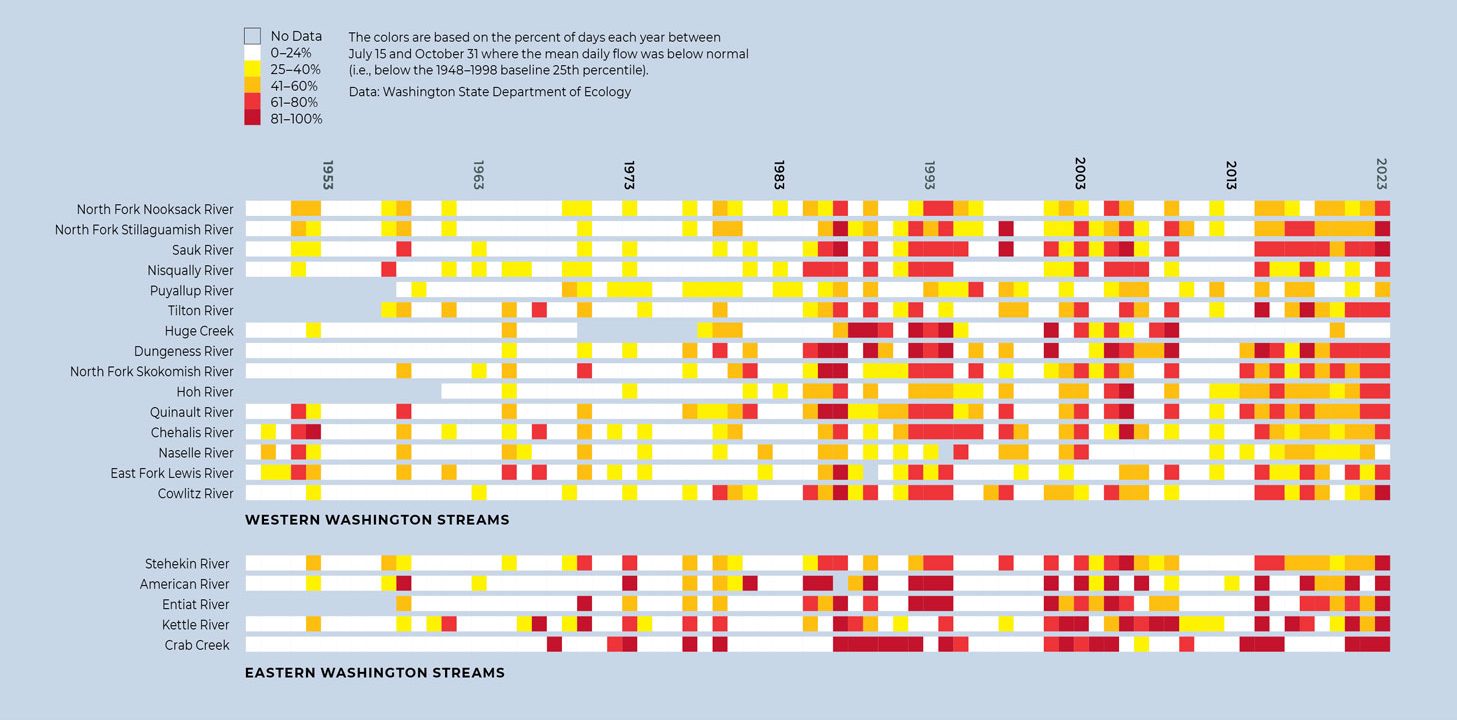
Salmon require cool, clean water. For those that spend their youth in freshwater, such as coho salmon, steelhead trout, and some Chinook salmon, low flows (when less water is in the stream) can harm or kill fish because lower amounts of water warm more quickly than when there are higher water flows. Similarly, salmon that migrate to freshwater in late summer and early autumn can encounter flows that are low enough and warm enough to prevent them from migrating or kill them outright.
Washington regularly experiences dry, warm summers, and climate change appears to be taking this pattern to extremes. Flows in snow- or groundwater-fed streams gradually diminish throughout the summer. Several decades of data show that with rising snow elevations and reduced snowpacks, low summer flows are becoming lower, warmer, and longer-lasting.
Human uses of water for farming, industry, and household use takes water from streams and groundwater, meaning there is less water in streams for fish. In some cases, these permitted water uses, known as water rights, are greater than the amount of water in the stream, creating dry stream beds instead of productive salmon habitat.
The figure below shows how low summer flow conditions are becoming more common in sampled Washington streams, especially since 1985. While some years still have good flow for salmon during summer, dangerously low flows are becoming more frequent.
Water Temperature Trends in Low-Flow Conditions

PRIORITIES AND PROGRESS
![]()
Washington State, through the Department of Ecology, has developed rules for maintaining minimum flows and maximum temperatures for streams in many areas of the state. These rules ensure that water withdrawals supporting development will not create water shortages for salmon.
In areas of the state where legal rights to withdraw water create low-flow conditions that harm salmon, groups are working to buy water rights to keep water in streams with grants from the Salmon Recovery Funding Board and other sources. Landowners also are working to upgrade their irrigation systems with more efficient watering systems and lined or enclosed irrigation ditches, which decrease the amount of water needed to grow crops. These improvements may be eligible for grants to reduce costs to the landowner, such as the Conservation Commission’s Irrigation Efficiencies Grant Program.
1Washington State Department of Ecology and King County. (2011) Control of Toxic Chemicals in Puget Sound: Assessment of Selected Toxic Chemicals in the Puget Sound Basin, 2007-2011. Washington State Department of Ecology, Olympia, WA and King County Department of Natural Resources, Seattle, WA. Ecology Publication No. 11-03-055. www.ecy.wa.gov/biblio/1103055.html.
2Washington State Blue Ribbon Panel on Ocean Acidification (2012): Ocean Acidification: From Knowledge to Action, Washington State’s Strategic Response. H. Adelsman and L. Whitely Binder (eds). Washington Department of Ecology, Olympia, Washington. Publication no. 12-01-015, p.43, https://fortress.wa.gov/ecy/publications/documents/1201015.pdf Accessed on November 9, 2020.
3Young, A., Kochenkov, V., McIntyre, J.K., Stark, J.D., and Coffin, A.B. (2018) Urban stormwater runoff negatively impacts lateral line development in larval zebrafish and salmon embryos. Scientific Reports. 8(1). https://www.nature.com/articles/s41598-018-21209-z.
4Tian, Z., Zhao, H., Peter, K. T., Gonzalez, M., Wetzel, J., Wu, C., … & Kolodziej, E. P. (2021). A ubiquitous tire rubber–derived chemical induces acute mortality in coho salmon. Science, 371(6525), 185-189.
5Tian, Z., Gonzalez, M., Rideout, C.A., Zhao, H.N., Hu, X., Wetzel, J., Mudrock, E., James, C.A., McIntyre, J.K., and Kolodziej, E.P. (2022) 6PPD-Quinone: Revised Toxicity Assessment and Quantification with a Commercial Standard. Environmental Science & Technology Letter 9(2), 140-146.
6Spromberg J.A., Baldwin D.H., Damm S.E., McIntyre J.K., Huff M., Sloan C.A., Anulacion B.F., Davis J.W., and Scholz N.L. (2016) Coho salmon spawner mortality in western US urban watersheds: bioinfiltration prevents lethal storm water impacts. The Journal of Applied Ecology. 53(2).
